1 School of Statistics, Dongbei University of Finance and Economics, Dalian, Liaoning 116025, China.
2 International Islamic University, Islamabad, Pakistan.
3 Jiangxi University of Finance and Economics, Nanchang, Jiangxi, China.
Corresponding Author Email: abdullahtanawli@gmail.com
Article Publishing History
Received: 22 August 2020
Accepted: 12 Nov 2020
Plagiarism Check: Yes
Reviewed by: Michael Ukwuru Nigeria
Second Review by: Monica Romania
Final Approval by: Min-Hsiung Pan
Article Metrics
![]()
![]()
PDF Downloads: 1826
Abstract:The most challenging problem in today’s world is food insecurity, an estimated approximately 832 million people around the world suffer from a lack of adequate and healthy food on a regular basis for their life. This problem is likely to intensify around the world due to high political risk and weak institutions. Hence, this study utilizes the country-level data, covering 124 countries in Asia, Africa, Europe, Latin America, and the Caribbean between 1984-2018 to examine the impact of political risk and institutions on food security, proxied by Dietary energy supply (DES). We have finalized the System-GMM from Pooled-OLS, Fixed-effect, Difference-GMM, and System-GMM, to recover the potential endogeneity and unobserved heterogeneity of the independent variables. Our outcomes provide supportive evidence that internal and external conflicts, socioeconomic conditions, corruption, military in politics, religious tensions, ethnicity tensions, and poor quality of bureaucracy worsen food security in developed and developing countries. While government stability, the role of law and order, democratic accountability, and investment profile affect the food supply positively and significantly.
Keywords:
Dynamic Panel Data; Food Security; Institutions; Political Risk
![]()
Download this article as:
Abdullah A, Qingshi W, Awan M. A, Ashraf J. The Impact of Political Risk and Institutions on Food Security. Curr Res Nutr Food Sci 2020; 8(3). doi : http://dx.doi.org/10.12944/CRNFSJ.8.3.21
Abdullah A, Qingshi W, Awan M. A, Ashraf J. The Impact of Political Risk and Institutions on Food Security. Curr Res Nutr Food Sci 2020; 8(3). Available From: https://bit.ly/32YUlS6
Introduction
Reducing the number of people suffering from severe food insecurity has improved significantly over the past decades. Many countries still have severe food insecurity, whether they are developing or developed countries 1–4 . As the Food and Agriculture Organization (FAO) found, 800 million people are hungry and an extra population burden; globally, it is challenging to eradicate hunger 5 . Food insecurity has an extreme effect on health, individual productivity, overall economic growth of the region, social peace, and general for learning 6–8 . A current study drafted by Food and Agriculture Organization (FAO), the World Health Organization (WHO), the United Nations Children Fund (UNICEF), the World Food Program (WFP) and International Fund for Agricultural Development (IFAD), more than 820 million people suffer from chronic malnutrition in the world, which was 804 million malnourished people in 2016 9,10 . Political instability, sectarian violence, and conflicts exacerbated the problem of hunger and eventually brought food security to a critical juncture 9 . Therefore, the FAO every year on 16 October, celebrates World Food Day to raise global awareness about food security and hunger and that emphasizes the need to keep food security problems at the top of the international research agenda and political plan, and to generate a conducive environment for increasing food security through proper investing and well policies 11 .
Food security term originates from the 1970s global food crisis 12 . It is a flexible conception that has been changed from time to time, representing the reconstructions of official thought on food security 12 . Based on the Committee on World Food Security (CFS) and Food Agricultural Organizations’ (FAO) existing food security definition is. “Food security happens when all people have physical, social, and economic access to adequate, secure and nutritious food at all the times that satisfy their nutritional needs and food preferences for an active and healthy life.” According to this definition, four pillars of food security are adapted: food availability, food accessibility, food utilization, and food stability 13 , 14 . In this study, food security is evaluated in terms of food availability. One of several factors suggested by FAO is utilized 14 . The dietary energy supply kilocalories per day per capita is used to measure food availability. Therefore, in this study, food security is measured by dietary energy supply (DES) (kcal/day/capita). The DES is an essential pillar of food security 14 .
Previous studies have identified many significant reasons for food insecurity, such as rapid population growth 15–18 , loss of arable land 19–22 , and income (GDP) 17,23 . With the level of food production not being able to sustain the growing number of people, which is reducing the arable land due to industry, and because of low incomes, it has caused persisting food insecurity in meeting human and nutritional requirements [1] , 18,24 .
Despite numerous studies highlighting the commitment to food security, one factor remains to be given more attention, Mainly due to the high quality of political risk data. This study focuses on several aspects of political risk and seeks to identify the factors of the political risks that are most important to food security[1]. Logically, it should be noted that political risk has a significant negative effect on food security in countries; uncertainty in food security comes due to several factors of high political risks and worsening political institutions[2], such as incompetence in government bureaucracy and corruption, unemployment and poverty (high-socioeconomic conditions), religious and ethnicity tension, internal and external conflicts, and when military involves in politics. It is clear that these factors also lead to political instability, which plays a dirty role in increasing the country’s food insecurity level and poverty 25 , 26 . In addition, other factors of political risk and institutions play a vital role in increasing the level of Dietary Energy Supply (DES), such as democratic accountability and the rule of (law and order), to enhance both measures of nutrition security and food. Good governance is strengthened by strong democratic institutions that elevate transparency and accountability, and that’s why food security levels and economic growth increase. For instance, the prohibition of corruption, strong democratic accountability, law, and order, government stability, play an important role in facilitating child malnutrition and reducing their stunting 27 .
The level of food security may decrease due to high political risk and weak institutions. As can be seen in the historical trend of political risk and Dietary energy supply, it is presented in Figure 1[1]. That high political risk and weak institutions could threaten countries’ food security levels and eventually increase food insecurity levels, and the level of hunger can become more worsening. However, a limited study is formally available to address this issue, and this study may be among the first to measure the effect of political risk and institutions on food security.
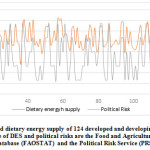 | Figure 1: Political risk and dietary energy supply of 124 developed and developing countries between 1984 and 2018. The data source of DES and political risks are the Food and Agriculture Organization Corporate Statistical Database (FAOSTAT) and the Political Risk Service (PRS) group 28 , 29 Click here to View Figure |
The purpose of this article is to inspect an extensive range of political risk components and to point out the significance of these political risk components for food security. We explore the effects of government stability, conditions of the socioeconomic, investment profile, the military in politics, religious tension, ethnic tensions, external conflicts and internal conflicts, corruption, law and order, the Quality of Bureaucracy, and democratic accountability; On the level of food security in 124 developed and less developed countries (Appendix A). Some components of these political risks have also been related to political institutions quality. Above all, the quality of bureaucracy is closely related to the strength of institutional of a particular country. Similarly, ensuring law and order and reducing the level of corruption are important determinants (and implications) of better institutions. These effects comprise the related sub-components of “Good Governance” overall assessment 30 . In a similar context, Greif and Kingston argued that an institution’s quality is often described as formal sets (For example, rules, laws, order, and constitutions), and informal constraints (For example, norms of behaviours, conventions, and self-imposed codes), that jointly motivating regularity in person and social behavior 31 , 4 . In this study, we utilize the dietary energy supply indicator of food security, a dynamic panel regression model was adopted, which is conducive to assessing the impact of long-term policy reforms for food security 4,32,33 . A dynamic panel data model with the generalized method of moments (GMM), the approach was employed to account for potential endogeneity, autocorrelation, omitted variable bias and unobserved heterogeneity of the independent variables 34–36 .
The rest of the paper is organized as follows: review past studies is in the next section, the variables and data set used in the regression model are presented in section 3, section 4 provides Methodology, including estimation strategies and model specification, the empirical results and its explanation stated in section 5, and finally, section 6 conclude the article.
Literature Review
There are several factors that have been found as critical to food security based on given theories. According to Malthusian theory, food shortages are caused by overpopulation 37 . that is why food insecurity occurs for a long period of time. In simple terms, the population grows faster than humanoid substances, such as food and agriculture products. By empirical analysis of Brown, Master, and Tian, more food demand increases after an increasing abundance of people and contributes to inadequate food to feed the whole population 15,38,39 . For example, water and land use rise significantly in many Populations; as a result, the capacity of farming production is affected 38 . Likewise, Tian claimed that rapid population growth has significantly affected food availability and has lead to food insecurity, mostly in central South and northern America, Southeast Asia, and sub-Saharan Africa 39 . As time went on, the Malthusian theory began a revitalization in the form of Neo Malthusian. Considering the original Malthus, the Neo Malthusian only adds to the classic Malthus theory that in addition to population size, the arable land is too considered a vital source of food security. Liu and Schneider have been identified that the arable land is more important for food security and food production 21,40 . A real examplar of this would be the industrialization in China, which has occupied a large amount of land to the detriment of agricultural activities 40 . Therefore the arable land is the most important of farming activities; without the arable land, it is impossible to secure food production 21 . In short, Malthus classical theories and Neo Malthusian show that population growth and arable land play a key role in meeting the requirement for food.
The Food Entitlement Declaration (FED) theory suggests that food shortages are caused by a lack of privileges, indicating that certain groups of people do not have access to adequate food 41 . FED’s theory raises concerns about food access, or it can be called a demanding aspect of food security. In these aspects, the third indicator that needs to be verified for food security is income. Pingali, in this aspect, emphasizes that economic access to food has been proven by growing their ability to buy home-made protein and nutritious food from income 42 . There will be more food in the house when the house has more income, and vice versa. Therefore, under the strategy to reduce appetite and malnutrition by meeting dietary requirements and food preferences for an active and healthy life, higher income levels (i.e., provide more jobs or a better political system) is compulsory.
The fourth factor that needs to be verified for food security is trade openness. Hanie and Pangaribowo in this context argued, that increasing trade openness in a country could result in a rise in the total amount of food available to the national population and a variety of foods available to help increase food security 43,44 . Globally, international trade can link food production and consumption and thus play a key role in enhancing food security; because it allows global production to take place in regions that are suitable for it and is able to supply food from countries that have abundant food supplies 45 . Dithmer empirically examined that the trade openness influence on food security is positive and statistically significant, and calorie consumption trade openness also increases food quality and food diversity-related aspects of food security 32 . Biniaz also empirically measured the effect of trade openness on agriculture has food security levels increasing positively and significantly 46 . Consequently, for a 1 percent increment in the degree of agricultural trade openness, the long-term growth in the food security index would increase by 0.21 percent 46 .
It should be noted, so far, no research has examined the combined effect of all 12 indications of political risk (and institutions) on food security[1]. However, some studies have checked the relationship of some of these indicators with food security. Helal globally checked that food insecurity had increased significantly in countries facing corruption 47 . Corruption hinders social and economic development, negatively affects international and regional development agencies’ efforts to combat hunger and famine in a systematic way, and disrupts market operations 48 . Helal and Uchendu clearly stated that corruption thrives in societies when there are failures in governance or weak government institutions 47,48 . Due to weak political institutions and bad governance, it leads to high-level corruption and rapidly decreases food security. In this regard, Zhou argued that the political institution’s quality is considered an essential component in promoting a conducive environment that plays a crucial role in food security 49 . He further claims that apart from Political institutions, any country’s food security could not be better and argued that food security is a high level in a country where these institutions work correctly. And where the food insecurity is high level, these institutions don’t work correctly. In this context, Smith claims that the government’s four aspects, the prohibition of corruption, strong democratic accountability, political stability, law, and order, play a vital role in facilitating child malnutrition and reducing their stunting 27 . Government efficiency, political stability, democratic accountability, and the rule of law and order enhance both measures of nutrition security and food 4,50 .
Good governance is strengthened by strong democratic institutions that elevate transparency and accountability, and that’s why food security levels and economic growth increase 50 . In the same way, due to bad governance and rampant corruption, conflicts are arises within the country or between countries, which is the biggest threat to food safety 51–53 . For instance, more than 60 percent of the world’s hungry and 75 percent of the stunted children under age five live in conflict-affected countries, while these alarming statistics indicate the adverse effects of conflict on food security 54,55 . Conflicts are caused not only by poor governance and widespread corruption but also by religious and ethnic tensions 56 . Fox said that religion and ethnicity tension had been a major cause of internal conflicts (for example, civil disorder or political violence, civil war, terrorism), which play a significant role in destroying a country’s food security 56,57 . In this context, Brinkman argued that food insecurity arises, especially when food prices rise, and this increase is due to the increased risk of democratic breakdown, protests, civil war, and sectarian strife 58 . Further, Mauro and Montalvo claim that religious polarization does not directly affect economic development but is important in explaining investment rates, government spending, and the potential for civil war 59,60 . However, ethnicity tension directly affects economic growth and is also important in explaining the potential for civil war 60 .
So, the concluding remarks from the above past studies, that political stability and institutional reforms are essential for the country to attain a stable food supply and thus enhanced long-term food security, while the political conditions and general social and economic affect undernutrition (the fundamental causes in Figure 2) 43,49,61 .
Figure 2: A Conceptual Undernutrition Framework
Variables and Data
We used a panel sample of 124 countries (developed and developing) throughout 1984-2018[1]. Our main goal is to examine the political risk and institution’s influence on food security. We have taken data of all the variables from three main sources, the dependent variable taken from Agriculture Organization Corporate Statistical Database (FAOSTAT) 29 . Information on political risk and institutions have taken from the International Country Risk Guide (ICRG) provided by the Political Risk Services (PRS) Group 28 , and the World Bank (WB) provides the information about control variables 62 . We have measured the level of food security through the Dietary Energy Supply (DES) in terms of kilocalories per capita per day (kcal/capita/day). Information on the dietary energy supply, provided by (FAOSTAT) 29 , which is the largest global dataset available for this kind of data.
Measuring food security can be difficult, given the many components that affect food supply and demand, and which ultimately helps determine if an individual has adequate access to food that will meet their nutritional needs. It’s complicated to estimate the quantity of food an individual or each household consumes at the macro level almost impossible. It is necessary that appropriate alternative action or proxy is mandatory. Therefore, this research work will depend on an aggregate measure that captures the available Dietary Energy Supply (DES) in terms of (kcal/capita/day). The (DES) is an important component of food security in the literature used 43,63–67 . This measure is calculated by the country’s total food supply, which is available for domestic consumption and is distributed by the size of the population to reach per capita.
The data used for political risk and institutions in this study are taken from the International Country Risk Guide (ICRG) provided by the Political Risk Services (PRS) group 28 . The ICRG delivers information regarding the political institution and political risk. The political risk and institutions indicator comprises a total of 12 subcomponents. The detail information is available in Appendix B[1]. Each component is allotted a numerical value within a specified range from 0 to 100, is then divided into categories[2] , 68 , with low values representing the weak political institutions and high political risk country while high value representing the better political institution and less political risk country. In general, these indicators of political risk and institutions are extensively recognized and used as political risk and high-quality institutional measures[3].
The first one in all the control variables data that world bank provided is the Population (POP) which measured in terms of annual population growth rate 62 . The second one is Arable Land (AL) as a percentage of total land size (the size of the land is a proxy that can be plowed and used to grow crops). The third one is income denoted by the Gross Domestic Product (GDP). And the last one is Trade Openness (TO) an overall country’s exports and imports are measured as a percentage of the country’s GDP.
The explanation and source of all variables are the symbols used for the empirical purpose.
Table 1: Source of the Data and explanations of variables
| Symbols | Variables | Explanations | Source |
| Dependent variable | |||
| FS | Food security | the food security level assessed through the Dietary energy supply (DES) in terms of (kcal/capita/day). | FAOSTAT |
| Control variables | |||
| POP | Population growth | The annual population growth rate in percentage | World Bank |
| AL | Arable land | agricultural land as a percentage of the total land | World Bank |
| TO | Trade openness | Trade as a percentage of gross domestic product (GDP) | World Bank |
| Political variables | |||
| GST | Government stability | Sum of government unity, legislative strength, popular support, (scale 0 to 12) | PRS Group |
| SEC | Socioeconomic condition | Sum of unemployment, consumer confidence, poverty, (scale 0 to 12) | PRS Group |
| INVP | Investment Profile | Sum of contract viability/expropriation, profit repatriation, payment delay, (scale 0 to12) | PRS Group |
| INTC | Internal conflict | Sum of coup threat /civil war, political violence/terrorism, civil disorder, (scale 0 to 12) | PRS Group |
| EXTC | External conflict | Sum of war, foreign pressures, cross border conflict (scale 0 to 12) | PRS Group |
| CORR | Corruption | Corruption level, (0 to 6 scale) | PRS Group |
| MINP | Military in politics | The influence of the military in politics, (0 to 6 scale) | PRS Group |
| RELT | Religious tensions | Tension in religious groups, (0 to 6scale) | PRS Group |
| LAO | Law and order | Sum of law and order, (0 to 6 scale) | PRS Group |
| ETNT | Ethnic tensions | Tension in ethnic groups, (0 to 6 scale) | PRS Group |
| DEMA | Democratic accountability | the government Democratic accountability (0 to 6 scale) | PRS Group |
| BURQ | Bureaucracy quality | Quality of the Bureaucracy and institutional strength, (0 to 4 scale) | PRS Group |
Source: FAOSTAT stands for food and agricultural organization corporate statistical database, PRS Group stands for the political risk service group and World Bank 28,29,62 .
Table 2 provides information about the summary of statistics which include total observations, mean, minimum, maximum, and standard deviation values of each series earlier transformation into logarithm form.
Table 2: Descriptive Statistics, 1984-2018
| Variables | Obs | Mean | S.Dev | Min | Max |
| FS (DES) | 4340 | 2747.489 | 505.619 | 1241 | 3828 |
| POP | 4340 | 1.512 | 1.407 | -7.09 | 15.18 |
| AL | 4340 | 16.198 | 14.541 | -0.42 | 73.39 |
| GDP | 4340 | 12076.47 | 16356.39 | 164.192 | 92119.52 |
| TO | 4340 | 75.804 | 44.07 | 0.02 | 442.62 |
| GST | 4340 | 7.114 | 2.553 | 0.00 | 12.00 |
| SEC | 4340 | 5.332 | 2.477 | 0.00 | 11.00 |
| INVP | 4340 | 7.054 | 2.872 | 0.00 | 12.00 |
| INTC | 4340 | 8.356 | 2.991 | 0.00 | 12.00 |
| EXTC | 4340 | 9.208 | 2.898 | 0.00 | 12.00 |
| CORR | 4340 | 2.779 | 1.427 | 0.00 | 6.00 |
| MINP | 4340 | 3.566 | 1.914 | 0.00 | 6.00 |
| RELT | 4340 | 4.340 | 1.651 | 0.00 | 6.00 |
| LAO | 4340 | 3.423 | 1.595 | 0.00 | 6.00 |
| ETNT | 4340 | 3.765 | 1.584 | 0.00 | 6.00 |
| DEMA | 4340 | 3.703 | 1.776 | 0.00 | 6.00 |
| BURQ | 4340 | 2.032 | 1.204 | 0.00 | 4.00 |
We have already stated that our purpose was to inspect the effect of political risk, institutions on food security, assessed by dietary energy supply (DES), in terms of (kcal/day/capita) through a dynamic panel (GMM) generalized method of moment approach. According to the prior studies of Subramaniam and Masron, we used the following econometric structure 4,69 .
Methodology
Malthusian and Neo-Malthusian, emphasize in their theory that the main reason for food insecurity in the presence of more people than the quantity of food supply 37 . Malthus claims in its theory that the leading cause of food insecurity is the rapid population growth 37 . Everything in the world progresses over time. Similarly, progress has been made in the classical Malthusian theory, which is called by the name of Neo-Malthusian theory. The Neo-Malthusian approach is that food insecurity occurs due to limited and finite land 70 . It is a common argument that as the population grows, the demand for food increases and the use of arable land also increases. Hence the basic food security equation can be written as follow.
![]()
Where FS denotes the food security assessment by dietary energy supply, POP stands for population growth, and AL represents the Arable land. The food consumption or demand determined by many variables such as trade openness (TO), and income (GDP) 32,39,42,67 . Hence the food security function can be rewritten as follow.
![]()
A country’s food insecurity cannot be eradicated unless its better institution quality and less political risk. The political risk and institution are the most important in affecting countries’ food security 4,43,49 . Zhou and Pangaribowo in this regard claim that apart from better institutions and less political risk, the food security of any country could not be better 43,49 . So, to finalize the econometrics model by incorporating the political risk and institutions variable.

Where is indicating political risk and institution of the 12 indicators. In the final model, the estimated parameter is while the error term is . The subscript indicates the countries and denotes time-period for each country. Further, to transform all the variables into a logarithm. Then Equation (3) can be written as follows.
![]()
Where is the log form of food security, the set of the explanatory variables is including population growth, arable land, income, trade openness, and political risk and institution. The nature of our data is a panel. So, according to Arellano and Blundell, we adopt a dynamic panel (GMM) generalized method of the moment 34,35 . To inspect the effect of political risk and institutions on food security for the cross-section of countries. For the potential endogeneity of explanatory variables, the GMM plays a vital role. Hence, Equation (4) can be seen in the form of a dynamic panel regression model.
![]()
Where denotes the country-specific effect unobservable. To avoid unobservable we followed the role of Arellano the role is to take the first difference-GMM of Equation (5) 34 . Then we have a new equation becomes.

According to Arellano, the lag explanatory variables use in level as the instrument 34 . Because the above Equation (6) produces a correlation among the lagged explained variable and the new error term. And because of this correlation:
![]()
we have the problem of endogeneity 4,69 . To solve this problem, we should need to follow another estimator called System-Generalized Method of Moments (GMM) 35 . The System-GMM constructed from the estimation of a structure of two simultaneous Equations, one in first difference (with lagged level as an instrument), and the other in level (with a lagged first difference as an instrument). This two-moment condition as follows:
![]()
The System-GMM is a more accurate estimator in a dynamic panel data model than estimator first difference-GMM 35 . Additionally, in the generalized method of moment approach, the scaler p-value is utilized to comparison high-quality (superiority) among the System-GMM and the first difference GMM 35 . Furthermore, we consider two kinds of test statistics to justify the validity of the GMM estimator. Hansen and the serial correlation test. The first one Hansen test is utilized to inspect the validity of the generalized method of moment estimator 71 .
The second for the serial correlation properties test is [AR(1)] and [AR(2)][1] , 34 . For further specification, Arellano and Blundell have told that a good estimate of the lag-dependent regressor should fall in the range of its fixed effect and pooled OLS 34,35 . Thus these estimates test a useful solidity on the results.
Empirical Results
The level of the food security, measured through dietary energy supply (DES), in the 124 countries of the world, were lower in Yemen, Ethiopia, Uganda, Guinea-Bissau, Bangladesh, Niger, Pakistan, Armenia, Azerbaijan, Guinea, Nigeria, Moldova, Iraq, Croatia, Kenya, Tanzania, Malawi, Mozambique, Zambia, Zimbabwe, Congo, Angola, Namibia, Botswana, Madagascar, Togo, Liberia, Sierra Leone, Bolivia, Nicaragua, Haiti, Mongolia, Burma, and higher in Japan, Australia, New Zealand, Finland, Sweden, Netherlands, Iceland, united states, Canada, Ireland, Portugal, France, Italy, Switzerland, Austria, Germany, Poland, Denmark, Norway, Greece, Turkey, Israel, and Egypt (see Figure.3)[1]. Countries with low food security levels among them are 20 countries whose low food security level is due to high political risk and weak institutions are three from eastern
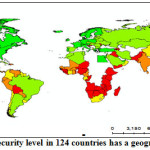 | Figure 3: The food security level in 124 countries has a geographical distributionClick here to View Figure |
Africa, seven from western Africa, one from south-eastern Asia, two from southern Asia, four from western Asia, one from the Caribbean, one from eastern Europe, and one from southern Europe[1]. Before the average dietary energy supply (DES), The lowest level of DES (1241(kcal/capita/day) in 1984) was in Ethiopia. At the same time, the highest level of dietary energy supply (3539 (kcal/capita/day) in 1984) was in Ireland. Regarding the political risk rating, Yemen had the lowest level with 2129 DES (kcal/day/capita) in 2018, In contrast, the United states of America had the highest level with 3828 DES (kcal/day/capita) in 2018.
In Table 3: We summarized a correlation matrix results of the key variables 72 . All the 12 components of the political risk and institutions have a positive and strongly significant correlation with food security. Besides that, (GDP, TO, AL) is also significantly and positively correlated with food security, except populace growth (POP) has a negative and highly significant relations with food security (FS), which confirms the current literature that determines food security.
Table 3: Correlation Matrix
Note: if the value of (P<0.01) then ***, if the value of (P<0.05) then **, and if (P<0.1) then *. FS. Stands for food security; POP stands for the population growth; AL stands for arable land; GDP indicates the gross domestic product; TO stands for trade openness; GST stands for government stability; SEC stand for socioeconomic; INVP stand for investment profile; INTC stands for internal conflict; EXTC stand for external conflict; CORR stand for corruption; MIN stand for the military in politics; RELT stand for religious tension; LAO stand for law and order; ETNT stands for ethnic tension; DEMA stand for democratic accountability, and BURQ stands for bureaucracy quality.
The descriptive tests of the System-GMM estimators mentioned under Table.4 propose the eligibility of System-GMM estimators. The criteria for serial correlation [AR (1)], which accepted the alternative hypothesis (H1) that is the first-order autocorrelation. While [AR (2)] accepted the null hypothesis (H0) that is the no second-order autocorrelation. About instrument validity, Hansen test statistic presents that the instruments used are valid.
The outcomes of the estimated model, as shown in Table 4, are in line with our expectations that the level of food supply declined with the growing populace. The statistically significant and negative value of population growth (POP), the level of food security has been shown to decrease by 3.6%, with a 1% increase in population. From the consequences, we can confirm according to prior studies, that inadequate food supply is a major factor in population growth, leading to hunger 4,18,32,38,69 .
Table 4: Regression Models (Static and Dynamic Panel Model), 1984-2018
| Variables | Pooled OLS | Fixed-Effect | Difference-GMM | System- GMM |
| Dependent Variable | ||||
| LnFSt-1 | 0.879***(139.12) | 0.652***(62.85) | 0.461***(35.33) | 0.797***(79.10) |
| Control Variables | ||||
| lnPOP | -0.048***(-8.26) | -0.022***(-3.02) | -0.016***(-9.49) | -0.036***(-10.53) |
| lnAL | 0.007***(4.76) | 0.075***(9.57) | 0.044***(7.63) | 0.014***(6.11) |
| lnGDP | 0.008***(7.78) | 0.046***(14.89) | 0.080***(34.90) | 0.013***(8.81) |
| lnTO | -0.001(-0.35) | 0.013***(4.51) | 0.004**(2.46) | 0.012***(7.20) |
| Political Variables | ||||
| lnGST | 0.036***(5.30) | 0.020***(2.96) | 0.003(1.08) | 0.010**(2.52) |
| lnSEC | -0.021***(-3.06) | -0.009(-1.16) | -0.003(-0.60) | -0.022***(-3.68) |
| lnINVP | 0.012*(1.74) | 0.016**(2.11) | 0.008***(3.06) | 0.095**(2.38) |
| lnINTC | -0.025***(-2.95) | -0.058***(-6.72) | -0.111***(-10.97) | -0.079***(-9.66) |
| lnEXTC | -0.027***(-3.67) | -0.035***(-4.20) | -0.098***(-8.37) | -0.100***(-10.42) |
| lnCORR | -0.031***(-3.31) | -0.032***(-3.00) | -0.052***(-3.86) | -0.052***(-7.29) |
| lnMINP | -0.014*(-1.92) | -0.007(-0.70) | -0.023***(-2.91) | -0.049***(-7.86) |
| lnRELT | -0.057***(-7.43) | -0.047***(-4.07) | -0.111***(-5.84) | -0.054***(-3.07) |
| lnLAO | 0.011(1.14) | -0.001(-0.11) | 0.019(1.12) | 0.059***(2.98) |
| lnETNT | -0.033***(-4.12) | -0.043***(-3.53) | 0.025(1.50) | -0.113***(-7.19) |
| lnDEMA | -0.010(-1.37) | -0.005(-0.55) | 0.109***(11.04) | 0.030***(3.13) |
| lnBURQ | -0.011(-0.96) | -0.043***(-3.07) | 0.007(0.23) | -0.030**(-2.31) |
| Hansen Test | 108 | 109 | ||
| AR (1) | -7.61*** | -7.85*** | ||
| AR (2) | -0.40 | -0.15 |
As expected, also, the statistically significant and positive value of trade openness (TO) showed a positive influence on food security. As trade grows, so improves a country’s food security level. Thomas, Dither, and Fusco have argued with reference to this result that increasing food supplies can reduce consumer prices, especially for developed countries, making it easier to buy food products 32,67,75 .
Regarding agricultural land, we find that the arable land (AL) variable has a statistically significant and positive impact on food security. Negash, Swinnen, Subramaniam, and Masron have stated with reference to this outcome that the incrementation in the food supply is due to the incrementation in agricultural land 4,69,76 . An interesting fact about the enlargement of agricultural land is that as a means of production, this land can provide maximum income to the poor agricultural landowners whether the government will help or not. So, in food production, the arable land is the major factor in providing more food resources. Our experimental results highlight the status of the economic feature at the level of food security. The coefficient among our food security (proxied by Dietary Energy Supply) and the explanatory variable (GDP) statistically significant and positive. Therefore, the citizen of a country with a high income have good access to quality food 67,69,77 . Hence, having adequate income levels can help individuals achieve adequate nutrition and energy intake levels.
Moving to discuss our main points, as corruption (CORR) indicate that increasing the level of corruption strongly negatively affects the food security level. This result is in line with the results reported by food and agricultural organization in 2018, who argue that the main reason for corruption is that 196 million people in India suffer from chronic Malnutrition 9 . However, we are able to verify food and agricultural organization results in dynamic regression analysis. The coefficient between our independent variable (Bureaucracy) and the dependent variable (Dietary energy supply) was negative and significant. Therefore, Malnutrition and food insecurity in India due to widespread instability in government bureaucracy and due to weak political institutions 9,49,78 9,78 . Weak institutions would increase food insecurity in the country, so the food security level is greatly affected by the level of Bureaucracy 49,79 .
Our results further confirmed that the statistically significant and negative value of the external-conflict (EXTC) Indicates that food and nutrition insecurity is becoming increasingly concentrated in external conflict-affected countries. As a result, between 2015 and 2018, the figure of malnourished people improved by 23.4 million – a significant increase compared to non-conflict countries 10 . Our results further indicate that the internal conflict (INTC) is the leading cause of food insecurity. Hendrix and FAO in this aspect, clearly stated that civil disorder or political violence, civil war, terrorism is a vital factor behind severe food insecurity and high food prices 9,53 . One hundred and twenty-four countries sample are included in our study, most of which are developing countries. The majority of malnourished people due to race, nationality, or language division (ethnic tension) are found in developing countries 10 . Similarly, Religious stresses can lead to the dominance of society and/or rule by a one religious group seeking to change the civil law to religious law and exclude all other religions from the social and/or political process, and such a religious group wants to supremacy (governance); as well as pressure on religious freedom. And such a religious group that also wants to implement its identification apart from the whole country. Under these circumstances, inexperienced people run the government, which makes wrong policies that lead to internal and external conflicts, which plays a vital role in ruining food security 9,80 .
The negative sign and strongly significant coefficient of the military in politics (MINP), showing that due to the military in politics, the economic growth going on to decreases 81 . while economic growth plays a vital role in enhancing the food security level and reducing the food shortage especially of a developing country 66,82 . Further, a relevant and more beautiful argument is given by David G. Acker, who has said that in a democratic country there has never been a famine in any era, Acker said that in countries with multiple elections and dynamic, free media, there are strong political incentives for famine prevention and economic security freedom and the freedom to live 83 .
The contrary part of the above eight negative and significant political indicators, in the two-step System-GMM results, the sign of government stability (GST), and law and order (LAO) positively and significantly affect the food supply. It shows that Good governance and better institutions are considered an essential element in promoting a conducive environment that plays a vital role to national nutrition, food security, and economic growth. The result of GST and LAO is in line with the results reported by Ogunniyi, has argued that due to political stability, government effectiveness, and the rule of law had enhanced the level of food security and decreased hunger 50 . The significance level of the GST and LAO estimated coefficient is at 5% and a one % level. Next, the positive and significant coefficient for democratic accountability (DEMA), show that the level of democratic accountability of the government is important over time for food security. For instance, Smith argued that the role of democratic accountability in facilitating child malnutrition and national food availability is highly positive 27 . He also claims that the government democratic accountability and four other components of governance such as government stability, bureaucracy quality, restraint of corruption, law and order played essential facilitating roles in, safe water access, child stunting, and food supply.
Conclusion
This study empirically examined the association among food security and political risk and institution’s variables using dynamic panel data for 124 countries from 1984 to 2018 in the global (Asia, Europe, Africa, Latin America, and the Caribbean), based on System- GMM, Difference-GMM, Fixed-Effect, and Pooled-OLS models. According to the outcomes of the System-GMM, we concluded that all factors of political risk and institutions significantly affect food supply, four of them (i.e., government stability, the rule of law and order, investment profile, and democratic accountability) affect the food supply positively and significantly. Besides that, socioeconomic condition, internal conflicts, external conflicts, corruption, military in politics, and ethnicity tensions, religious tensions, and bureaucracy quality negatively and significantly affect food supply. Food insecurity occurs when there are high-level political risk and weak institutions. So, the conclusions of this article that high-level political risk and weak institutions are perilous for food security, which ensures an unstable food supply.
Acknowledgements
We thank our respected reviewers and especially to Wang Qingshi for their valuable comments and suggestions that really helped us to improve this paper.
Funding
We have not received any funding from any organization.
Conflict of interest
The authors declare that there is no conflict of interests regarding the publication of this paper.
References
Appendix A: Developed and Developing Countries Sample
| Developed and Developing Countries Sample | |||||
| Albania | Viet Nam | Ukraine | Turkey | Armenia | Hong Kong |
| Azerbaijan | Austria | Zimbabwe | Panama | Gabon | United Arab Emirates |
| Israel | Malaysia | Bulgaria | Burkina Faso | Burma | Colombia |
| Ecuador | Cote d’Ivoire | Bolivia | Cameroon | Guinea | Suriname |
| Chile | Croatia | Russia | Cyprus | Czech Republic | Denmark |
| Dominican Republic | Canada | Hungary | Nicaragua | Malta | Iceland |
| France | Finland | Belarus | South Africa | Germany | Ghana |
| Peru | Guatemala | Congo | Guinea-Bissau | Netherlands | Norway |
| Saudi Arabia | Australia | Egypt | Ethiopia | Poland | Indonesia |
| Iran | Tunisia | Ireland | Botswana | Italy | Jamaica |
| Sri Lanka | Venezuela | Kazakhstan | Kenya | Korea, Republic of | Trinidad and Tobago |
| Honduras | Nigeria | Liberia | Sierra Leone | Madagascar | New Zealand |
| Brazil | Mali | Estonia | Angola | Mongolia | Morocco |
| Mozambique | Namibia | Guyana | Malawi | El Salvador | Togo |
| Lebanon | Haiti | Uganda | Pakistan | Bangladesh | Senegal |
| Greece | Philippines | India | Portugal | Republic of Moldova | Romania |
| Cuba | Latvia | Paraguay | Lithuania | Slovakia | Slovenia |
| Gambia | Spain | Japan | Costa Rica | Sweden | Tanzania |
| Yemen | Niger | Kuwait | Iraq | Argentina | Oman |
| Mexico | China | Switzerland | United States | Uruguay | Jordan |
| Algeria | Thailand | Zambia | Bahamas | ||
Appendix B: The detail explanation of political risk components
| The detail explanation of political risk components | |
| Political risk components | Description |
| Government stability | Measures the ability of government to put its policies into practice and stay in government |
| Socioeconomic condition | It affirms the social and economic pressures of those working in a society that can hinder the functioning of the government or promote social dissatisfaction and thus destabilize the political system. (poverty, unemployment) |
| Investment profile | It is an estimate of components that affect investment risk that is not included in other financial, economic, and political risk components. |
| Internal conflict | It is an estimate of the real or potential effects of political violence on governance in the country. |
| External conflict | The external conflict measure is an assessment both of the risk to the incumbent government from foreign action, ranging from non-violent external pressure (diplomatic pressures, withholding of aid, trade restrictions, territorial disputes, sanctions, etc) to violent external pressure (cross-border conflicts to all-out war) |
| Corruption | This is a measure of the level of corruption |
| Military in politics | this is an estimate of the involvement of the army in politics. The army joins the government when there are internal or external threats to the country. But I don’t think it’s an excellent solution to such problems; it hurts the country’s economy |
| Religious tensions | Religious tensions may stem from the domination of society and/or governance by a single religious group that seeks to replace civil law by religious law and to exclude other religions from the political and/or social process; the desire of a single religious group to dominate governance; the suppression of religious freedom; the desire of a religious group to express its own identity, separate from the country as a whole. The risk involved in these situations range from inexperienced people imposing inappropriate policies through civil dissent to civil war and external conflicts. |
| Law and order | Gives legitimacy to law and order, i.e., the power and impartiality of the rule of law. |
| Ethnicity tensions | It is an estimate of the level of stress attributed to race, language division, or nationality. |
| Democratic accountability | It is related to the government’s democratic accountability, that is, the government’s response to its peoples, but also about fundamental civil freedoms and political rights. |
| Bureaucracy Quality | The institutional strength and quality of the bureaucracy is another shock absorber that tends to minimize revisions of the policy when governments change. |
Source: International Country Risk Guide (ICRG) 68
Appendix C: The Changes in Political Risk Rating and Food Security
| The Changes in Political Risk Rating and Food Security | ||||||||
| Very High-level Political Risk countries | Very low-level Political Risk countries | |||||||
| Changes 1984-2018 | Changes 1984-2018 | Changes 1984-2018 | ||||||
| Countries | PRIAVG | FSAVG | Countries | PRIAVG | FSAVG | Countries | PRIAVG | FSAVG |
| Ethiopia | 45.88 | 1795 | Azerbaijan | 34.80 | 2231 | Japan | 83.06 | 3285 |
| Haiti | 40.87 | 1925 | Guinea | 47.91 | 2185 | Sweden | 86.87 | 3291 |
| Zimbabwe | 49.43 | 2065 | Nigeria | 45.83 | 2088 | Australia | 83.84 | 3345 |
| Burma | 45.62 | 2067 | Republic of Moldova | 35.31 | 2223 | New Zealand | 86.62 | 3358 |
| Yemen | 46.47 | 2110 | Iraq | 35.24 | 2038 | Finland | 89.58 | 3376 |
| Sierra Leone | 47.58 | 2151 | Croatia | 41.29 | 2243 | Netherlands | 87.01 | 3302 |
| Togo | 49.61 | 2176 | Iceland | 86.19 | 3279 | |||
| Liberia | 40.12 | 2204 | Denmark | 85.15 | 3316 | |||
| Uganda | 49.45 | 2222 | Canada | 85.10 | 3339 | |||
| Guinea-Bissau | 46.44 | 2157 | Norway | 87.24 | 3363 | |||
| Bangladesh | 48.00 | 2176 | Switzerland | 89.25 | 3406 | |||
| Niger | 49.89 | 2197 | Ireland | 83.83 | 3611 | |||
| Pakistan | 46.19 | 2200 | Austria | 85.93 | 3613 | |||
| Armenia | 33.55 | 2220 | United States | 82.46 | 3638 | |||
NOTE: PRIAVG, the political risk index is measured by the average[1], While FSAVG, food security is also measured by the average of dietary energy supply. The higher value of PRIAVG indicating better institutions and less political risk countries, while the higher value of FSAVG indicating high food secure country.
Source: Food and Agriculture Organization Corporate Statistical Database and the Political Risk Service Group 28,29,68 .
This work is licensed under a Creative Commons Attribution 4.0 International License.